
Data visual screen
Make production data available, from presentation to decision support
Building production monitoring screens and management cockpits based on real-time data collection, supporting the deployment of Web end and large screen televisions, and translating decentralized process data into visualized decision support.
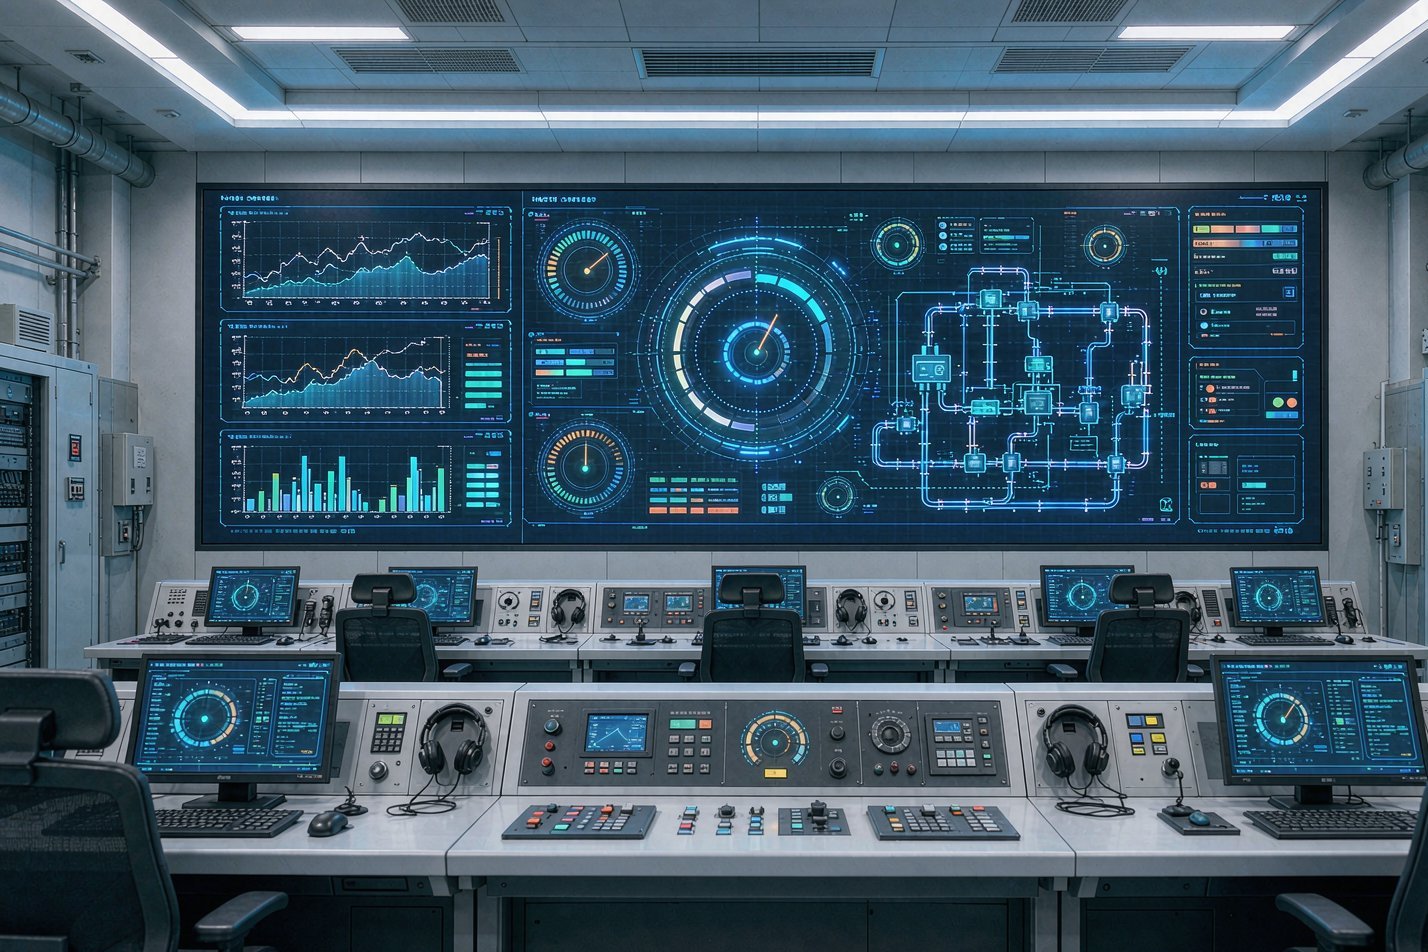
Overview
Overview of services
- ✓ Real time data drive, second-level refreshing, aberrant state priority.
- ✓ # Bus screens, watchroom television, office computers and mobile multi-end self-adaptation
- ✓ The auto-discharge of historical data, generation of a single key in the daily newspaper
How can the data be really “used” by management and producers when they are collected? The data visualization large screen service brings together data scattered in DCS, PLC and instrument systems into a unified real-time view: tank slots and inventories, terminal measurements and energy consumption, equipment operation and alarm status, organized by role, and organized into teams to monitor screens, plant cockpits and mobile panels. Our big screen program is based on Web technology, supporting multi-end adaptation displays of large screens, watchroom television and office computers; The image tissue follows the “5 seconds to read” principle - the abnormal colour and position are given priority, trends and fine-spectrum drilling; The automated repository of historical data supports the generation of a single key in newspapers, daily newspapers and monthly newspapers, allowing screens to go beyond displays and to serve as a basis for daily movement and appraisal.
Capabilities
Service capacity
Driving module design: Organization of image levels by the information needs of the director, dispatch, class and three categories of players
Real-time monitoring: retrofitting and animation of tanks, measuring, energy consumption, seconds of equipment status
Alert management: colour and sound strategy for hierarchical alerts, and display of important anomalies
Trends analysis: historical curves, comparative analysis and automatic generation of newspapers/dailies/monthly newspapers
Multi-end adaptation: integration of screens, television, computers and mobile phones into the layout, with data configured multiple-end
Process
Service flow
01
Indicator combo
(c) To collate the indicators, thresholds and priorities of interest to the various actors.
02
Visual design
Output screen prototype and visual script, confirming layout, motion and colour.
03
Development of linkages
Intersect real-time databases, complete panel development and data reconciliation.
04
Deployment training
Field deployment to the main screen terminals, completion of training and handover.
Deliverables
Delivery
- ✓ Largescreen prototype and visual design
- ✓ Visualize large screen system (Web deployment package)
- ✓ Data interface and indicator calibration
- ✓ Use of manuals and training records
Applications
Typical application scenario
- ▸ Large control screen for production in plant/station depot
- ▸ Group/corporate level operating management cockpit
- ▸ Digitalization of the exhibition hall and reception scenes on display
Apply
Data Visualize Screen - Application
Submit your service needs, and the Pu Yi team will contact you within 1 working day, communicate the range of services, time and offer.
- ✓The original engineer team leads
- ✓Clear service lines, processes and deliverables
- ✓Phased implementation to support window overhaul and privatization deployment